👁 2735 | Tristan Schulze lately updated this on Mai 7, 2023
rotational, voice controlled painting with mouse input advanced voice controlled painting with mouse input interpretations through manual Stable Diffusion img2img …
rotational, voice controlled painting with mouse input
let mic;
let lpf;
let fft;

let my_pmouseY = 0;

let thresholdy = 40;

let brighty = 0;

let mouseXPrev = 0;
let mouseYPrev = 0;
let motionAngle = 0;
let ler = 0.1;

function setup() {
  createCanvas(768, 512);

  mic = new p5.AudioIn();
  mic.start();
  lpf = new p5.LowPass();


  lpf.set(2400); // set the cutoff frequency of the filter
  fft = new p5.FFT();
  fft.setInput(mic); //the cutoff frequency of the filter

  //lpf.setInput(mic);

  background(53, 94, 111);


}

function draw() {

  //rotateY(.75);

   for (let i = 0; i< 20; i++){

       let rx = random(width*3);
     let ry = random(height*3);

     noStroke();
     fill(255, random( 52,11));
     rect(rx,ry,2,2 );

   }


  let spectrum = fft.analyze(); // analyse the spectum
  noStroke();
  fill(255, 0, 155);
  for (let i = 0; i< spectrum.length; i++){

    let mycolor = spectrum[i];

    let th = abs( my_pmouseY - mouseY );
    let dir = my_pmouseY - mouseY;
    if(dir<0){

      th *=-1;

    }
    if(mycolor > thresholdy && mouseIsPressed){

       mycolor += random( -20,20 );

      fill( mycolor); // pick a drawing color

      // 0  - 255

      let from = color(37, 150, 190);
      let to = color(255, 24, 11);

      let mixed_col = lerpColor(
        from,
        to,
        (mycolor - thresholdy ) / (255-thresholdy)
      );

      fill(mixed_col);
      // x , y , w ,h
    //  rect( i*.13 + mouseX, mouseY,1,th ); // draw a rect
    //  rect(  -i*.13 + mouseX, mouseY,1,th ); // draw a rect


      //rect(width- (i*.13 + mouseX), mouseY,1,th ); // draw a rect
     // rect(width- ( -i*.13 + mouseX), mouseY,1,th ); // draw a rect

        // Draw the motion angle
        push();
        translate(mouseX,mouseY);
        rotate(motionAngle);

        rect(i, 0, 1,th*2 );
        pop();


    }

  }

  my_pmouseY = mouseY; //save the current pos a old one


      // Calculate the motion angle
        let dx = mouseX - mouseXPrev;
        let dy = mouseY - mouseYPrev;
        let targetAngle = 2*Math.PI - atan2(dy, dx);
        motionAngle = lerp(motionAngle, targetAngle, .03);


        // Save the current mouse position
        mouseXPrev = mouseX;
        mouseYPrev = mouseY;


}

function mouseReleased(){

  brighty+=1;
  ///filter(BLUR,1);

}
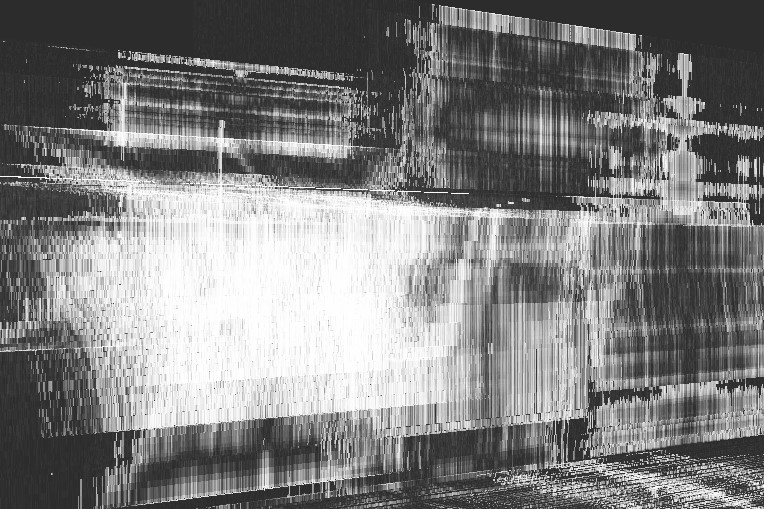
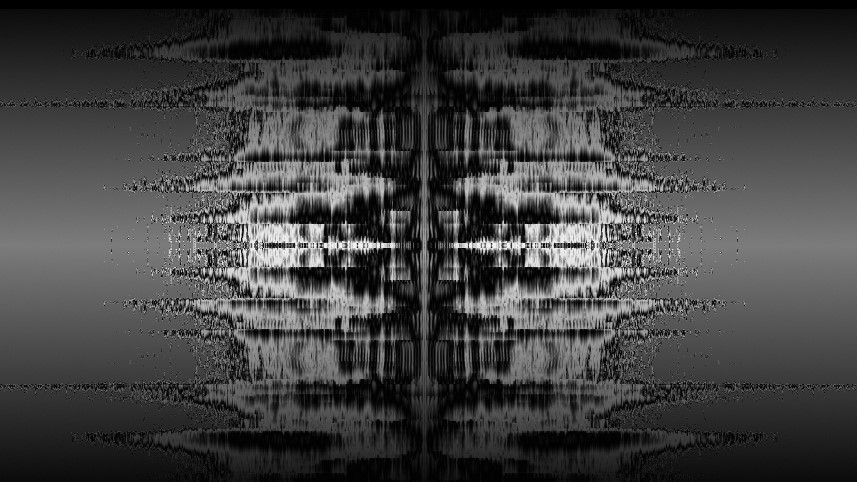
advanced voice controlled painting with mouse input
raw output coming from fft analysis and moise movement
let mic, fft;
let lpf;
let tick = 0;

let bw = 512;

let running = false;

let centerOffX = 0;
let centerOffY = 0;


let pcenterOffX = 0;
let pcenterOffY = 0;

let buffer = [512];
let pbuffer = [512];

let psum = 0.0;

function setup() {
  createCanvas(768, 512,WEBGL);

   mic = new p5.AudioIn();
  mic.start();
  lpf = new p5.LowPass();
 // mic.connect(lpf);
  lpf.set(12400); // set the cutoff frequency of the filter
  fft = new p5.FFT();
  fft.setInput(mic); //the cutoff frequency of the filter
  background(44);
}

let main_rot = 0;

function mousePressed(){
  centerOffX = mouseX-width;
  centerOffY = mouseY-height;
   tick=0;
  // background(44);
   main_rot = int(random(-2,2))*.4;

}

function draw() {

  if(mouseIsPressed){
    running = true;
     centerOffX = mouseX-width;
     centerOffY = mouseY-height;

  }else{
    running = false;
  }

   translate(width/2+centerOffX,height/2+centerOffY,12);

  rotateY(.25);

 // rotateX(1.25);

   //rotate(millis()*.001);
   // rotate(main_rot);


  if(running){
   // analyze frequency data
     let spectrum = fft.analyze();

 let sum = 0.1;

    // loop through spectrum data
    for (let i = 0; i < spectrum.length; i++) {
      // calculate bar height based on amplitude of frequency

    //  let loga = 20 * Math.log10(spectrum[i]);
      let loga = 10 * Math.log2(spectrum[i]);
      noStroke();

      sum += float(spectrum[i]);

       let shrink = 1- tick / (height*.5);

        loga *= psum*.01;
        let filli = (sin (loga*.24)+1)*122;

        filli += random(0,3);

       if(loga <10){

        filli = 0;

      }

      fill( 255,filli*.6 );

       buffer[i] = filli;

      // draw in both directions mirored
      /*
      rect( i*.25,tick,1, 1);
      rect(-(i*.25) ,tick,1, 1);
      rect( i*.25,-tick,1, 1);
      rect(-(i*.25) ,-tick,1, 1);
      */
       // draw in position mirrored
     // rect( i*.25,0,1, 1);
     // rect(-(i*.25) ,0,1, 1);

    }

     sum /= float(spectrum.length);


    drawBuffer();


    psum = sum;

    pcenterOffX =  centerOffX;
    pcenterOffY =  centerOffY;


      tick++;
    }


}

function drawBuffer(){

  for (let i = 0; i < buffer.length; i++) {

     buffer[i] += random(-10,10);

     fill(  255, buffer[i]*.6 );

    let absy = abs(pcenterOffY -  centerOffY);
    if(pcenterOffY<centerOffY){ absy*=-1;}

    if(tick==0){ absy=1;}

      rect( i*.31,0,1,absy );
      rect(-((i)*.31) ,0,1,absy);
      //stroke(i*.25,0, i*.25+pcenterOffX,0+pcenterOffY);

  }

}
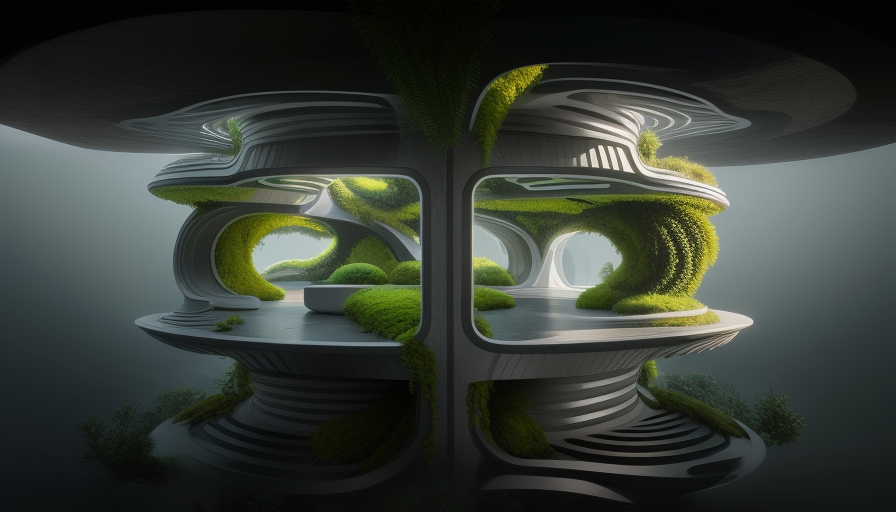
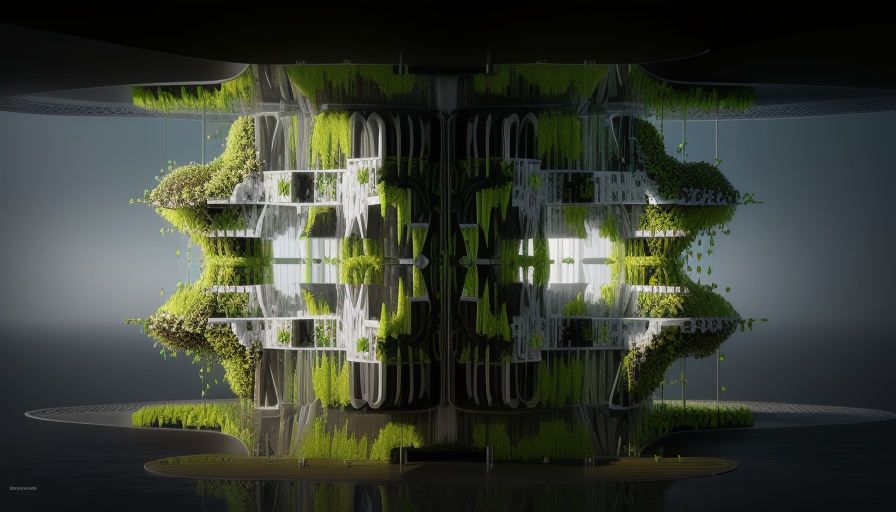
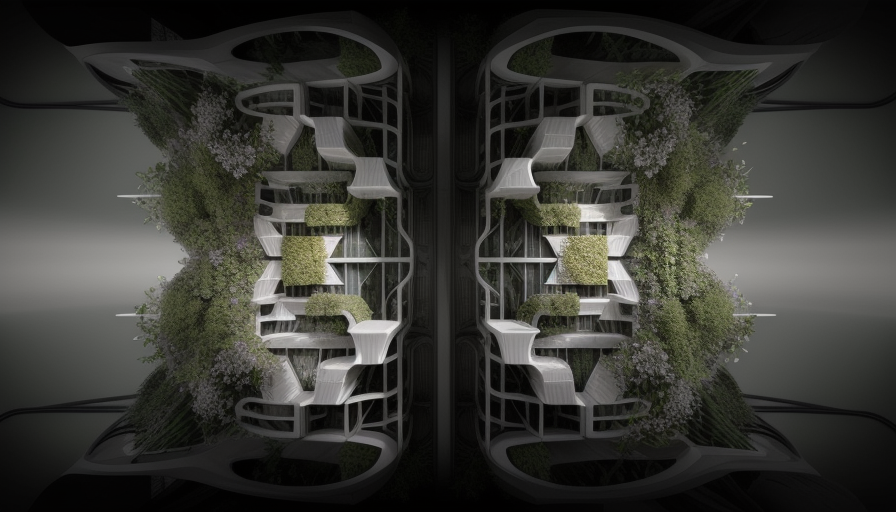
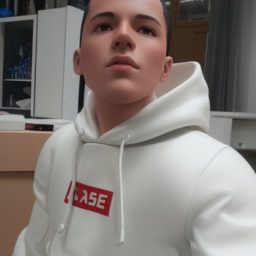
interpretations through manual Stable Diffusion img2img
img2img using ControlNet 1.1 / Cannyimg2img using ControlNet 1.1 / Cannysimple img2img
basic setup of fft analysis
let mic, fft;
let lpf;
let tick = 0;

let bw = 1024;

function setup() {
  createCanvas(1024, 512);

   mic = new p5.AudioIn();
  mic.start();
  lpf = new p5.LowPass();
 // mic.connect(lpf);
  lpf.set(12400); // set the cutoff frequency of the filter
  fft = new p5.FFT();
  fft.setInput(mic); //the cutoff frequency of the filter
  background(0);
}

function draw() {


    translate(width/2,height/2);

   // analyze frequency data
     let spectrum = fft.analyze();

   // let spectrum = fft.analyze(bw, "hann", bw);

     //let spectrum = fft.logAverages(30, 20, 20000);

    // set fill color for spectrum bars
    fill(255, 0, 0);

    // loop through spectrum data
    for (let i = 0; i < spectrum.length; i++) {
      // calculate bar height based on amplitude of frequency


    //  let loga = 20 * Math.log10(spectrum[i]);
      let loga = spectrum[i] = 10 * Math.log2(spectrum[i]);
      noStroke();

      if(loga <10){

        loga = 0;

      }else{


      }


       let shrink = 1- tick / (height*.5);

        let filli = (sin (loga*.24)+1)*122;
        filli *= shrink;

        filli += random(0,3);

         fill( filli );
      //fill(loga);
      // draw spectrum bar
      //rect(width/2+i,tick,1, 1);
      rect( i*.5,tick,1, 1);
      rect(-(i*.5) ,tick,1, 1);

       rect( i*.5,-tick,1, 1);
      rect(-(i*.5) ,-tick,1, 1);

    }

    if(tick>height/2){
      tick=0;
      background(0);
      //filter(BLUR,1);
    }else{
       tick++;
    }


}