This interactive visualization offers a clear and engaging way to understand the fundamentals of neural networks. Each node in the …
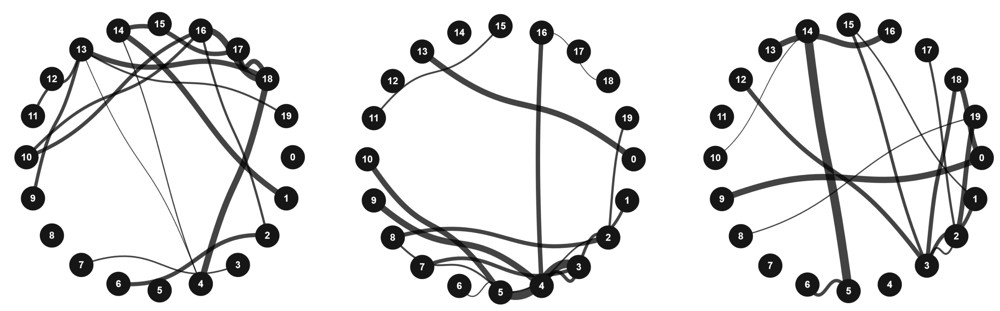
This interactive visualization offers a clear and engaging way to understand the fundamentals of neural networks. Each node in the canvas represents a neuron, and the connections between nodes illustrate the synaptic links found in artificial neural networks. The varying thickness of the connections shows the strength of these links, reflecting how different connections contribute to the network’s overall function.
As you add, remove, or adjust connections, you can see how the network’s structure evolves, mimicking the training process of a neural network where weights are updated based on new data. The circular arrangement of nodes provides an organized view of how neurons are interconnected and how their interactions influence the network’s behavior.
This visualization serves as a practical demonstration of machine learning concepts, making the abstract workings of neural networks more tangible and easier to grasp. It highlights key aspects such as node representation, connection weights, and dynamic updates, offering a hands-on approach to learning about neural networks.
code of the basic version
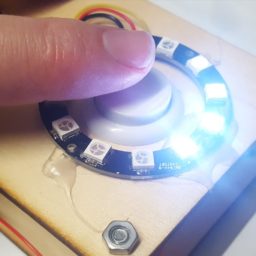
This setup uses you local storage of your browser to save necessary data to provide this basic neuronal training demo. Also play with it yourself here: ONLINE P5.JS EDITOR CODE
// This sketch visualizes a network of nodes with connections, where nodes are arranged in a circular layout. Connections between nodes are represented with bezier curves, and nodes are dynamically sized based on their connection count. Data is stored in and retrieved from local storage.

let connections = []; // Array to hold connections between nodes
let nodeRadius = 16; // Base radius for nodes (currently not used in the code)
let nodeDistance = 220; // Distance between nodes in the circular layout
let nodePositions = {}; // Object to hold the positions of nodes
const maxNodes = 20; // Maximum number of nodes to visualize
const baseSize = 20; // Minimum size for nodes
const maxSize = 50; // Maximum size for nodes

function preload() {
  // Load connection data from local storage or initialize to an empty array if not present
  let storedConnections = localStorage.getItem('connections');
  connections = storedConnections ? JSON.parse(storedConnections) : [];
}

function setup() {
  createCanvas(660, 660); // Create a canvas with a size of 660x660 pixels

  // Create buttons for user interaction
  createButton('WIPE').mousePressed(eraseAllEntries); // Button to erase all connections
  createButton('ADD').mousePressed(addRandomEntry); // Button to add a random connection
  createButton('UPDATE').mousePressed(visualizeConnectionsAndDraw); // Button to update the visualization

  // Initial visualization of connections
  visualizeConnectionsAndDraw();
}

function draw() {
  // The draw function is empty because visualization is controlled by button presses
}

function addConnection(subjectId, objectId, weight) {
  // Add or update a connection between nodes with a specified weight
  let existingConnection = connections.find(conn => conn.subjectId === subjectId && conn.objectId === objectId);

  if (existingConnection) {
    // If the connection already exists, increase its weight
    existingConnection.weight += 1.0;
  } else {
    // If the connection does not exist, add a new connection with an initial weight of 1.0
    connections.push({subjectId, objectId, weight: 1.0});
  }

  // Decrease the weight of all connections slightly and remove those with negative weights
  connections = connections.map(conn => {
    conn.weight -= 0.06;
    return conn.weight < 0 ? null : conn; // Remove connection if weight is below 0
  }).filter(conn => conn !== null);

  saveConnections(); // Save the updated connections to local storage
  visualizeConnectionsAndDraw(); // Update the visualization
}

function removeConnection(subjectId, objectId) {
  // Remove a connection between nodes
  if (Array.isArray(connections)) {
    connections = connections.filter(conn => conn.subjectId !== subjectId || conn.objectId !== objectId);
    saveConnections(); // Save the updated connections to local storage
    visualizeConnectionsAndDraw(); // Update the visualization
  } else {
    console.error('Connections is not an array');
  }
}

function editConnection(subjectId, objectId, newWeight) {
  // Update the weight of an existing connection
  if (Array.isArray(connections)) {
    for (let conn of connections) {
      if (conn.subjectId === subjectId && conn.objectId === objectId) {
        conn.weight = newWeight;
        saveConnections(); // Save the updated connections to local storage
        visualizeConnectionsAndDraw(); // Update the visualization
        break;
      }
    }
  } else {
    console.error('Connections is not an array');
  }
}

function saveConnections() {
  // Save the connections array to local storage
  localStorage.setItem('connections', JSON.stringify(connections));
}

function createRandomConnection() {
  // Generate a random connection with random subjectId, objectId, and weight
  return {
    subjectId: Math.floor(Math.random() * maxNodes), // Random subject node ID
    objectId: Math.floor(Math.random() * maxNodes), // Random object node ID
    weight: Math.random() // Random weight between 0 and 1
  };
}

function addRandomEntry() {
  // Create a new random connection and add it to the connections array
  let newConnection = createRandomConnection();
  addConnection(newConnection.subjectId, newConnection.objectId, newConnection.weight);
}

function eraseAllEntries() {
  // Remove all connections and update the visualization
  connections = [];
  saveConnections(); // Save the empty connections array to local storage
  visualizeConnectionsAndDraw(); // Update the visualization
}

function getNodeSize(id) {
  // Calculate the size of a node based on the number of connections it has
  let count = connections.reduce((acc, conn) => {
    if (conn.subjectId === id || conn.objectId === id) {
      acc++;
    }
    return acc;
  }, 0);

  // Scale the node size based on the connection count
  return constrain(map(count, 0, 10, baseSize, maxSize), baseSize, maxSize);
}

function drawConnections() {
  // Draw connections between nodes
  noFill();
  connections.forEach(conn => {
    let subject = nodePositions[conn.subjectId];
    let object = nodePositions[conn.objectId];
    if (subject && object) {
      // Generate a random offset for the bezier curve
      let offset = random(-10, 10); // Random offset for curve control points

      strokeWeight(map(conn.weight, 0, 10, 1, 100)); // Map connection weight to stroke width
      stroke(0,188); // Set stroke color to a shade of blue

      if (subject === object) {
        // Handle self-loops (connections from a node to itself)
        let r = getNodeSize(subject.id) * 1.5; // Radius for self-loop
        let ctrlX1 = subject.x + cos(random(TWO_PI)) * r;
        let ctrlY1 = subject.y + sin(random(TWO_PI)) * r;
        let ctrlX2 = subject.x + cos(random(TWO_PI)) * r;
        let ctrlY2 = subject.y + sin(random(TWO_PI)) * r;
        bezier(
          subject.x, subject.y,
          ctrlX1, ctrlY1,
          ctrlX2, ctrlY2,
          subject.x, subject.y
        );
      } else {
        // Draw normal connections
        bezier(
          subject.x, subject.y,
          (subject.x + object.x) / 2 + offset, (subject.y + object.y) / 2 - 50,
          (subject.x + object.x) / 2 + offset, (subject.y + object.y) / 2 + 50,
          object.x, object.y
        );
      }
    }
  });
}

function drawNodes() {
  // Draw nodes at their specified positions
  fill(100, 150, 255); // Node fill color

  textAlign(CENTER, CENTER); // Center align text
  textSize(16); // Set text size for node IDs
  textStyle(BOLD); // Make text bold
  noStroke(); // Disable stroke for nodes

  Object.keys(nodePositions).forEach(id => {
    let pos = nodePositions[id];
    let size = getNodeSize(id); // Get the size of the node based on connections
    fill(22); // Node fill color
    ellipse(pos.x, pos.y, size * 2); // Draw the node as an ellipse with dynamic size
    fill(255); // Text color
    text(id, pos.x, pos.y); // Draw the node ID at the center of the node
  });
}

function visualizeConnectionsAndDraw() {
  // Visualize connections and draw nodes and connections
  visualizeConnections(); // Generate node positions based on connections
  background(255); // Clear the canvas with a white background
  drawConnections(); // Draw connections between nodes
  drawNodes(); // Draw nodes at their positions
}

function visualizeConnections() {
  // Extract unique node IDs and arrange them in a circular layout
  let nodeIds = new Set();
  connections.forEach(conn => {
    nodeIds.add(conn.subjectId);
    nodeIds.add(conn.objectId);
  });

  // Limit to maxNodes unique node IDs
  if (nodeIds.size > maxNodes) {
    nodeIds = new Set(Array.from(nodeIds).slice(0, maxNodes));
  }

  // Calculate the positions for nodes in a circular layout
  let angleStep = TWO_PI / maxNodes; // Angle step between nodes
  let centerX = width / 2; // X coordinate of the center of the canvas
  let centerY = height / 2; // Y coordinate of the center of the canvas
  nodePositions = {}; // Reset node positions

  let i = 0;
  for (let id = 0; id < maxNodes; id++) {
    let angle = i * angleStep; // Calculate the angle for the node
    let x = centerX + cos(angle) * nodeDistance; // Calculate x position
    let y = centerY + sin(angle) * nodeDistance; // Calculate y position
    nodePositions[id] = { x, y }; // Assign position to node ID
    i++;
  }
}