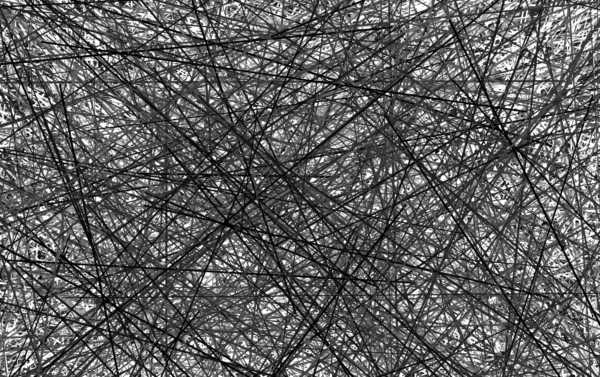
draw random lines by mic input
let pad = 200; // offset offstage

let mic;

function setup() {
  createCanvas(window.innerWidth,window.innerHeight);
  background(220);

    // Create an Audio input
  mic = new p5.AudioIn();

  // start the Audio Input.
  mic.start();

}

function draw() {


  let amp = mic.getLevel();


  // draw lines amount depending on mic amp

  for(let i=0;i<amp*1000;i++){

      stroke(amp*1555+ random(-40,40)); // color based on mic input +  slight random gray

      strokeWeight(random(1,5)); // random line width

      // random position
      let rx1 = random(-pad,width+pad);
      let ry1 = random(-pad,height+pad);

      let rx2 = random(-pad,width+pad);
      let ry2 = random(-pad,height+pad);

      line(rx1 ,ry1 , rx2 ,ry2 );

    }

}
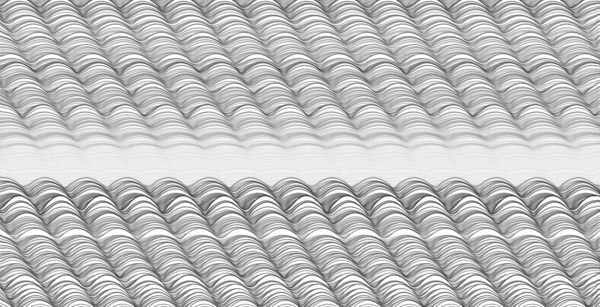
draw curved lines by mic input
let pad = 20; // offset offstage

let tick = 0; // ticker var we need for calcs

let mic; // mic instance

function setup() {
  createCanvas(window.innerWidth,window.innerHeight);
  background(220);

    // Create an Audio input
   mic = new p5.AudioIn();

  // start the Audio Input.
   mic.start();

}


// ------------------------------------

function draw() {


  // get the current mic amp
 let amp = mic.getLevel()*60;


  stroke(0,amp*70); // strokecolor along amp
  fill(255);

  // divide with in 100 steps for curve loop
  let x_step = width/100;

  // begin draw line
   beginShape();

    curveVertex(0,tick+20);

    for(let x=0;x<100;x++){

      let offy = abs(sin( x*12.1 + millis()*.001 ))*amp*15;
      curveVertex(x * x_step,tick-offy);

  }

  curveVertex(width,tick+20);

  endShape(CLOSE);

  // count ticker up
  tick++;

  // if ticker reaches bottom of stage - begin from top
  if(tick>height+pad){
    tick = -pad;
  }

}
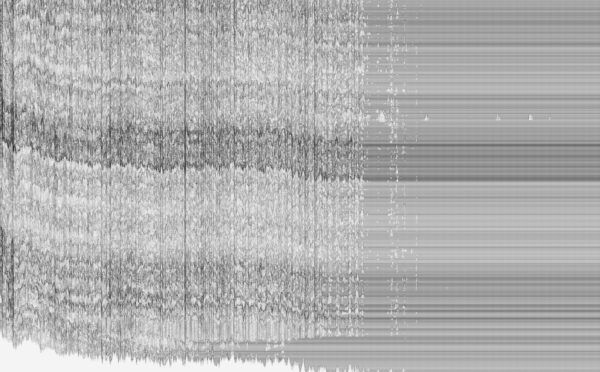
drawing fft based curve
let pad = 20; // offset offstage
let tick = 0; // ticker var we need for calcs
let mic; // mic instance
let fft; // fast fourier transform module

function setup() {
  createCanvas(window.innerWidth,window.innerHeight);
  background(220);

    // Create an Audio input
   mic = new p5.AudioIn();

  // start the Audio Input.
   mic.start();

  fft = new p5.FFT();

  fft.setInput(mic); // send mic input to fft analytics

}


// ------------------------------------

function draw() {


  // get the current mic amp
   let amp = mic.getLevel()*60;

  // analyze audio spectrum

  let spectrum = fft.analyze();


  stroke(0,amp*8); // strokecolor along amp


  fill(244);

  // divide with in 100 steps for curve loop
  let x_step = width/spectrum.length;

  // begin draw line
   beginShape();

    // this is a BUG workaround so the shape will be wellformed
     curveVertex(0,tick);
     curveVertex(0,tick);

    for(let x=0;x<spectrum.length;x++){

      let offy = spectrum[x]*.5;
      curveVertex(x * x_step,tick-offy);

  }

  endShape();

  // count ticker up
  tick++;

  // if ticker reaches bottom of stage - begin from top
  if(tick>height+pad){
    tick = -pad;
  }

}
band & centroid analysis

let pad = 20; // offset offstage
let tick = 0; // ticker var we need for calcs
let mic; // mic instance
let fft; // fast fourier transform module
let spectrum; // the spectrum

function setup() {
  createCanvas(window.innerWidth,window.innerHeight);
  background(220);

    // Create an Audio input
   mic = new p5.AudioIn();

  // start the Audio Input.
   mic.start();

  fft = new p5.FFT();

  fft.setInput(mic); // send mic input to fft analytics

}


// ------------------------------------

function draw() {


  // get the current mic amp
   let amp = mic.getLevel()*60;

  // analyze audio spectrum
  spectrum = fft.analyze();

  //setup stroke
  stroke(0,amp*26); // strokecolor along amp

  // calculate the center note
  let cn = returnCentroid();

  // fill color by centroid note
  fill(cn*255,44);


  // parse all frequency data!
  let scl = -.5;
  let b = fft.getEnergy("bass") *scl;
  let lm = fft.getEnergy("lowMid") *scl;
  let mm = fft.getEnergy("mid") *scl;
  let hm = fft.getEnergy("highMid") *scl;
  let t = fft.getEnergy("treble") *scl;


  // calc divider - onyl for layout
  let step = width/4.;


  // draw the curve
  beginShape();


   curveVertex(0,tick);
  curveVertex(0,tick);

  off = b;
  curveVertex(step*0,tick+off);

  off = lm;
  curveVertex(step*1,tick+off);

   off = mm;
  curveVertex(step*2,tick+off);

   off = hm;
  curveVertex(step*3,tick+off);

   off = t;
  curveVertex(step*4,tick+off);


  curveVertex(width,tick);

  endShape();

  // count ticker up
  tick+=2;

  // if ticker reaches bottom of stage - begin from top
  if(tick>height+pad){
    tick = -pad;
  }

}


function  returnCentroid(){

  let mainnote = fft.getCentroid();
  let nyquist = 22050;
  let mean_freq_index = mainnote/(nyquist/spectrum.length);
  centroidplot = map(log(mean_freq_index), 0, log(spectrum.length), 0, 1);

  return centroidplot ;

}